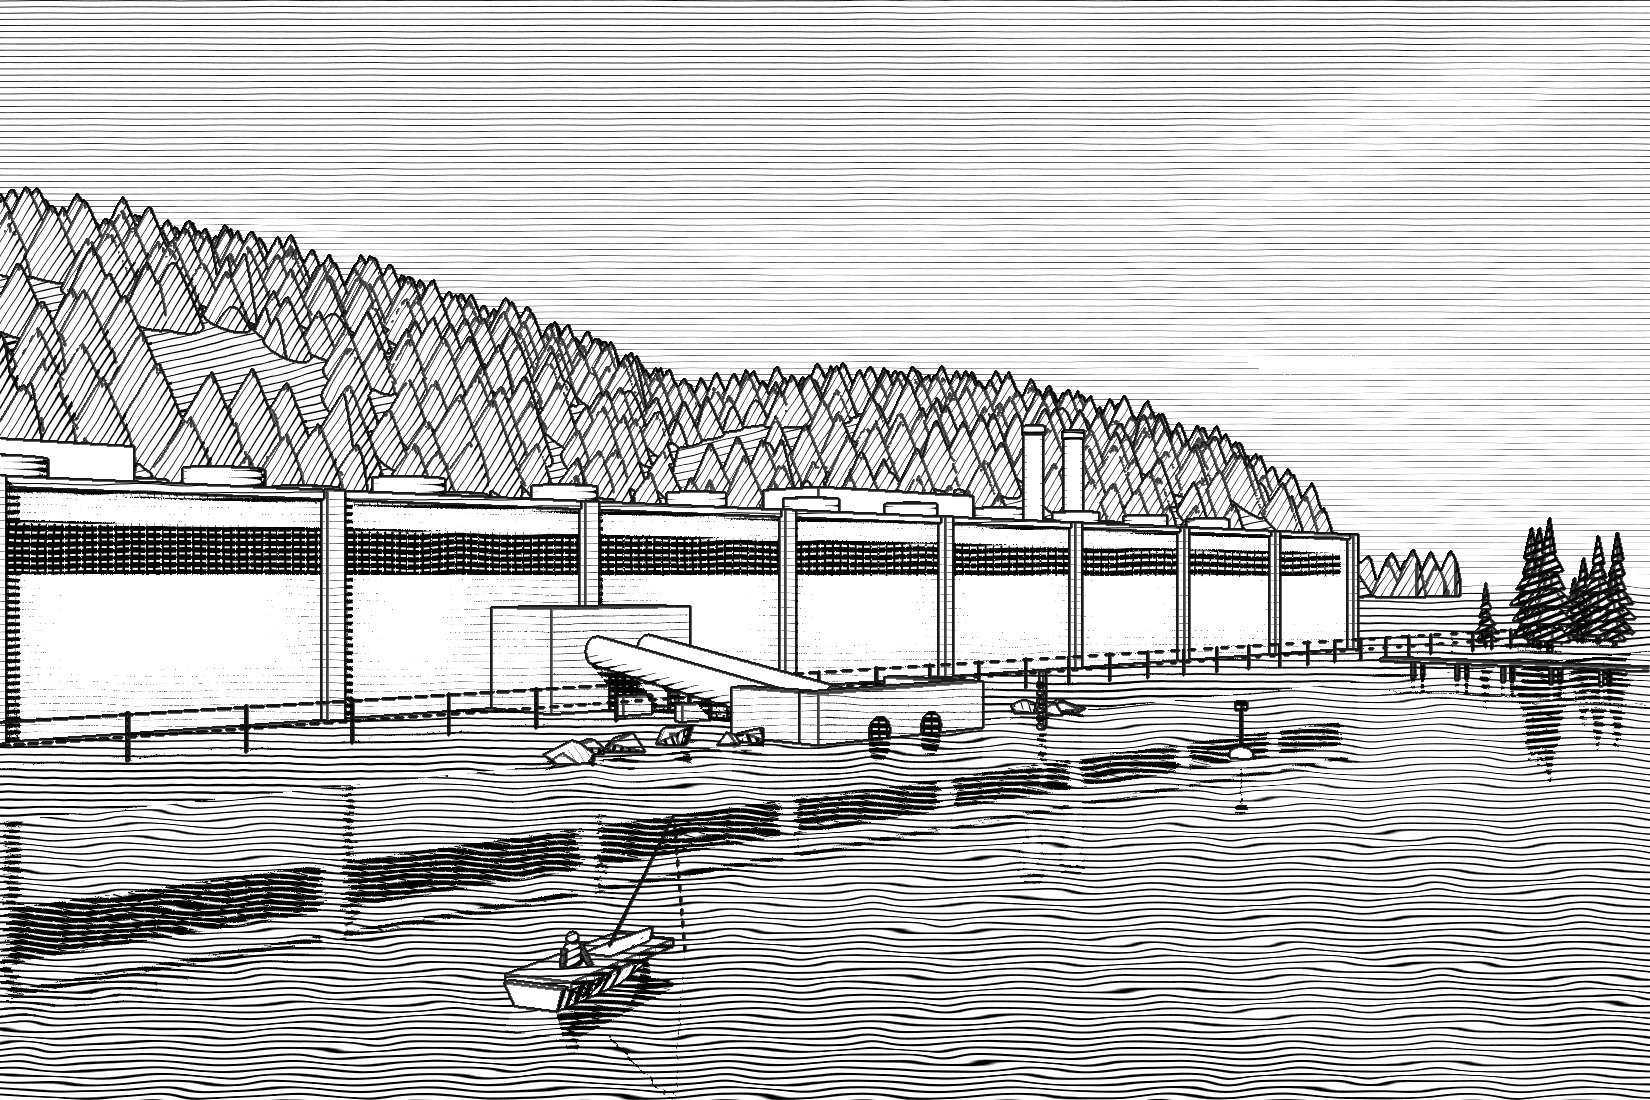
The Varne Estuary Bridge, opened in 2009, carries about 41,000 vehicles a day and 1,400 sensors. Engraving by Ottilie Marsh
Ines Calloway reads the Varne Estuary Bridge on Sunday mornings, at her kitchen table in Port Ellery, with a pot of coffee, a ruler, and a pencil. The bridge, two kilometers of concrete and steel cable carrying 41,000 vehicles a day between Halbridge and the south shore, is fitted with 1,400 sensors. Between them they record about 60 million readings a day. Calloway, a structural engineer with the Department of Public Works, looks at 40 of them.
She chose the 40 herself, in 2011, and has printed the same plots every week since: strain in the stay cables, tilt at the tops of the two towers, the temperature of the deck, the movement of the expansion joints at either end. She lays each week’s sheet beside the same week from previous years and runs her pencil along the lines. “It’s not sophisticated,” she said, on a Sunday in early October, a mug in one hand and a plot of the north tower in the other. “It’s just that nobody else is looking.”
Daniel Okafor is the magazine’s technology correspondent, covering infrastructure, old software, and the people paid to keep both running, from hospital pagers to a payroll system older than most of its maintainers. Before journalism he spent a decade as a systems administrator in the signaling office of the Corran Regional Railway, an experience he turned into the book Nothing Has Changed Since Tuesday. He lives in Corran, still carries a pager out of professional sympathy, and keeps a green-screen terminal on his desk that he insists is load-bearing.
Payroll, pensions and the water bills of a small country still run on code older than the engineers maintaining it. Meet the night shift that keeps it alive.
The Varne bridge is not unusual. Over the past two decades, bridges, tunnels, and dams have been fitted with instruments as a matter of course: strain gauges that measure how far steel stretches under load, tilt meters that notice a tower leaning by a fraction of a degree, accelerometers that record how a deck shivers when a truck crosses it. The sensors are cheap and getting cheaper. The people who know what their readings mean are not, and there are fewer of them every year. The result is a great deal of infrastructure that is, in the technical sense, monitored, and in every practical sense, not.
The quietest hour
Calloway’s plots cover the small hours of each Sunday, between 3 and 5 a.m., because that is when the bridge is quietest. Traffic falls to a few dozen vehicles an hour, the wind usually drops, and the deck has cooled and settled. With almost nothing happening on it, the bridge is mostly measuring itself. “It’s the resting pulse,” she said. “If the resting pulse changes, you want to know why.”
In February, the resting pulse of the north expansion joint changed. The joint is the toothed steel gap you feel as a double thud under your tires; it exists because the deck grows and shrinks with temperature, by about 30 centimeters between a January night and a July afternoon. On Calloway’s plots it had always traced a neat daily wave, opening in the cold of the night and closing in the afternoon sun. Over the previous 14 months, the wave had been flattening. On comparable days, the joint was moving about 15 millimeters where it used to move 40.
Nothing had raised an alarm. The monitoring system was set up to warn if the joint opened or closed beyond certain limits, and it hadn’t; it was simply doing less of both. But a joint that stops moving does not mean the deck has stopped growing. It means the growth is going somewhere else—in this case, into the bearings beneath the deck at the north abutment, which were being shoved a little harder each summer against a joint packed with grit and rust. In May the Department closed the northbound lanes for 11 nights, cleaned out the joint, and replaced two seized bearing guides. Left alone, Calloway’s report estimated, the problem would eventually have cracked the abutment, and the repair would have cost about 30 times as much and closed the approach for months.*
“Nothing was going to fall down,” she said. “That’s not how bridges usually go. They fail expensively, a long time before they fail dangerously. The data was telling us that for over a year. It just wasn’t telling anyone in particular.”
They fail expensively, a long time before they fail dangerously.
— Ines Calloway
Amber, all day
The monitoring system does have alarms, and the alarms are the second half of the problem. In 2025 the Varne bridge generated 11,412 automated alerts, an average of one every 46 minutes. Each is routed to the control room at the Halbridge end, a low building overlooking the toll plaza, where two operators watch traffic cameras, weather feeds, and a screen of colored tiles, one for each sensor. Amber means a reading has crossed a warning threshold. Red means it has crossed a higher one, and the system automatically telephones the on-call engineer.
Benji Adair, 31, has worked in the control room for six years, and he keeps the amber alerts muted. “If I rang someone every time a tile went amber, I’d be ringing them every 50 minutes, day and night,” he said. “They’d stop answering. They did stop answering, before my time.” The red alerts cannot be muted. Last year there were 432 of them, and according to the Department’s own review, three reflected a real change in the structure that an engineer needed to act on.† The rest were hot afternoons, cold snaps, convoys of heavy trucks, lightning near the cable anchorages, a maintenance van parked on top of a strain gauge, and a sensor whose cable had been chewed through by rats.
The thresholds were set in 2009 by the firm that designed the monitoring system, which went out of business in 2016. Its documentation says they were derived “from the design model.” The design model is stored in the file format of an engineering program that is no longer sold, on a disk in a filing cabinet at the Department’s offices in Corran, and nobody there has a computer that can open it. So nobody has adjusted the thresholds, because nobody knows exactly what they were meant to protect against, and lowering an alarm you don’t understand is how engineers end up giving evidence at public inquiries.
The effect is a system that cries wolf at precisely the wrong things. It is acutely sensitive to the weather, which the bridge was designed to shrug off, and indifferent to slow changes in behavior, which are what actually matter. A trend that develops over 14 months never crosses a threshold. It just quietly becomes normal.
Reading is the expensive part
The reason this keeps happening is not technical, and Calloway is the first to say so. Sensors are bought with capital money: they go into the budget for building or refurbishing a structure, alongside the concrete and steel, and they are easy to justify because they are tangible and comparatively cheap. The Varne’s 1,400 cost about 1 percent of the bridge. Reading them is an operating cost, which means a salary, every year, indefinitely. When the bridge opened in 2009, the Department had a monitoring unit of three engineers. By 2017 it had one: Calloway. Since 2021, when her post was folded into the general inspection team, it has had Calloway part-time, in the gaps between the inspections, reports, and meetings that fill her working week. Hence Sundays.
The wider pool is draining too. According to its staffing returns, the Department employed 41 chartered structural engineers in 2010; it now employs 17, and nine of them are over 55. The graduates it does hire tend to leave within five years for private consultancies, which pay better and mostly involve designing new things rather than looking after old ones. “Nobody goes into engineering to watch a graph,” said Owen Strachan, the Department’s deputy director for structures. “I understand that. I didn’t either.”
Strachan argues, reasonably, that much of the monitoring was never meant to be read every week. A large part of its value, he says, is forensic: if something happens to the bridge—a ship strike, an earthquake, a storm beyond anything in its design—the record lets engineers reconstruct exactly what the structure went through and judge whether it is safe to reopen. Calloway does not dispute this. She just finds the logic incomplete. “It’s a flight recorder,” she said. “Fine. But we’ve put a flight recorder on a plane we fly every day, and we only plan to read it after the crash.”
The obvious answer, offered to the Department by at least four vendors in the past two years, is software: anomaly-detection systems that learn a structure’s normal patterns and flag departures from them without anyone having to look at a plot. Calloway has sat through the demonstrations and is not hostile. A system that had flagged the north joint’s flattening wave would have been useful, she says, and the better products might have caught it. What she distrusts is the pitch, which tends to suggest that the software replaces the engineer rather than giving her something to do. “A machine that tells you something is different is useful,” she said. “A machine that tells you whether it matters is an engineer. Nobody has built that one yet, and if they had, it would want a pension.”
Meanwhile the data piles up. Seventeen years of readings from the Varne bridge sit on servers in Corran, more than 370 billion values in all. Calloway once worked out that her Sunday plots take in about one reading in every 3,000 the bridge produces. “And I’m the one who’s looking,” she said.
On the Sunday I visited, the plots were unremarkable. The north joint had its wave back, 40 millimeters on a sunny day, as it should. The south tower leaned a little toward the sea in the afternoon warmth and righted itself overnight, as it has every day since 2009. Calloway initialed each sheet in the corner, slid the pile into a folder, and finished her coffee. She is 58. She has told the Department she would like to retire at 63, and has asked, in writing, who will read the bridge after that. She has not had an answer. “I’m not worried about the sensors,” she said. “They’ll go on talking for years. I’m worried about the silence at this end.”
Notes
*The joint measurements come from Calloway’s internal report to the Department’s structures division, North Expansion Joint: Reduced Movement Range (March 2026), which compared 61 pairs of days with similar temperature swings in 2023–24 and 2025–26. The repair estimate for a cracked abutment assumes a closure of the north approach lasting four to six months. ↩
†Alert counts are from the Varne bridge control room log for 2025 (11,412 alerts: 10,980 amber, 432 red) and from the Department’s internal review of that year’s red alerts, both obtained by The Margin. The review classed a further 11 red alerts as real events within the bridge’s design limits, mostly gales, requiring no action. The 60 million daily readings assume one value from each sensor every two seconds, the rate at which the system logs them after the accelerometers’ raw output has been averaged. ↩