Each summer’s melt leaves a line. A team that has cored the same glacier for twenty-two years is reading those lines as a household reads its accounts.
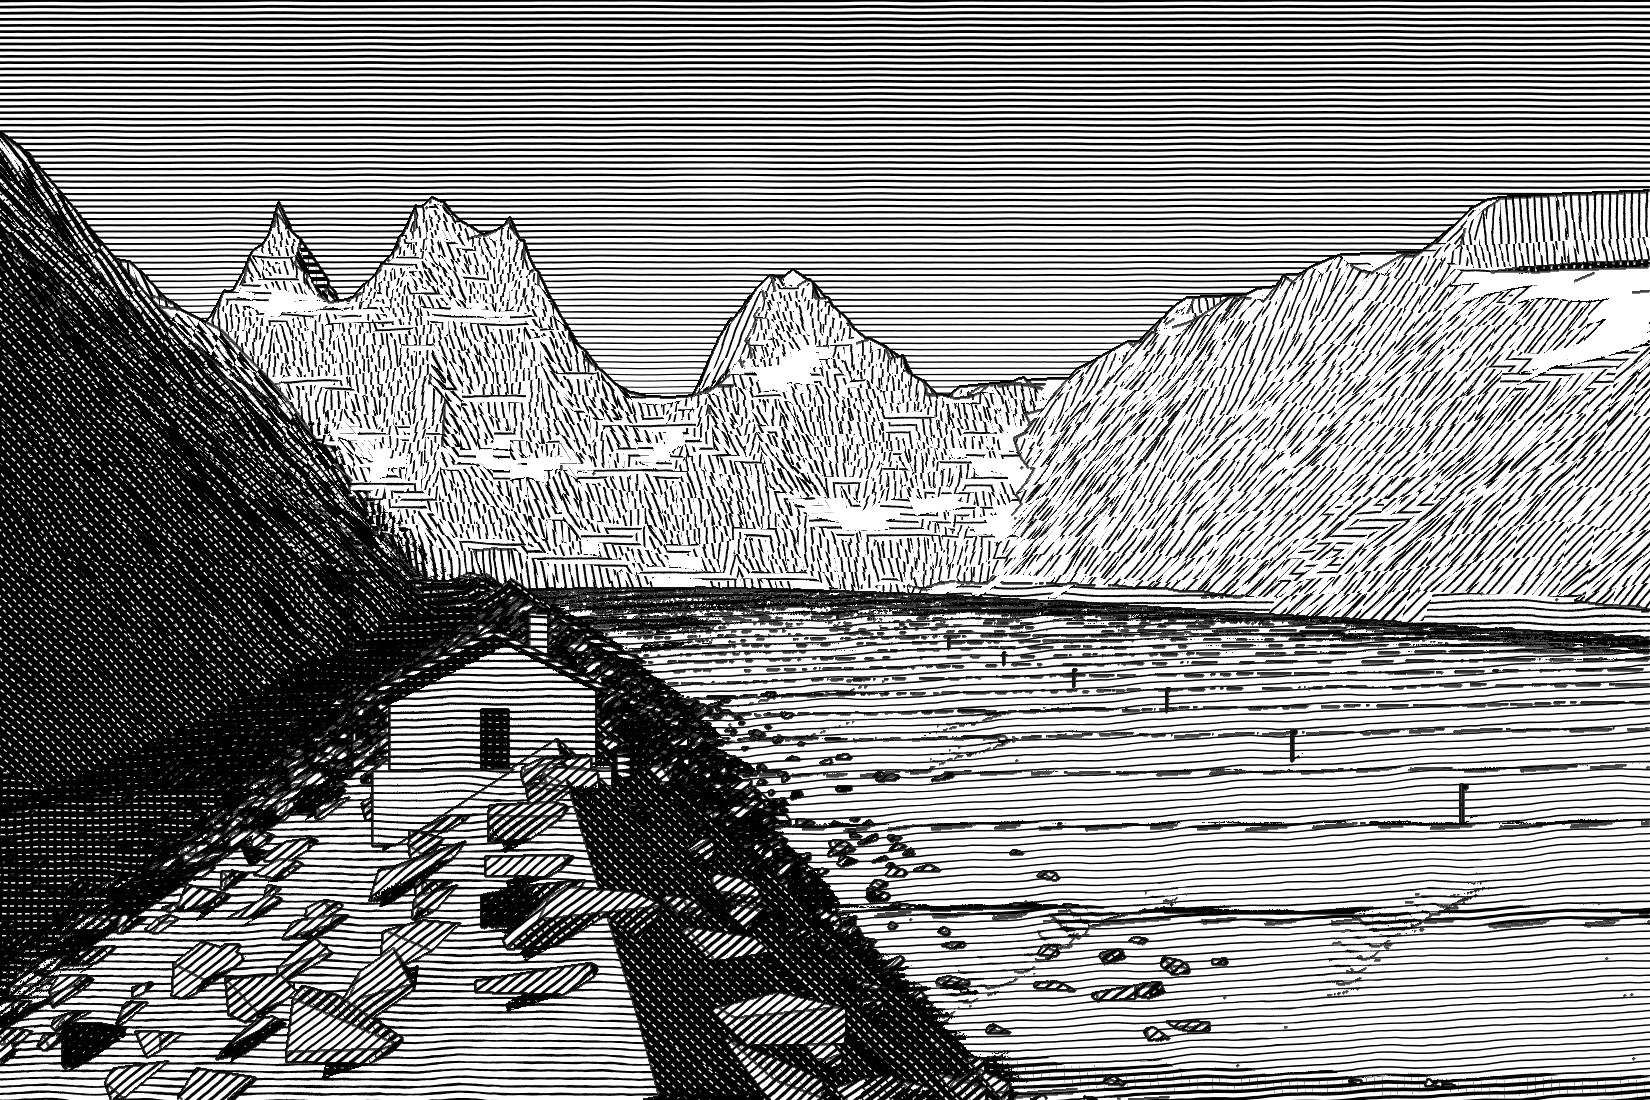
The Skarfjell hut stood at the edge of the ice when it was built in 1961; the glacier is now a 25-minute walk from its door. Engraving by Sunniva Holt
At ten past seven on the morning of September 16, the thermometer screwed to the door frame of the Skarfjell hut read minus four, and Matti Holm was already outside lighting the drill. It is a propane boiler bolted into a steel frame about the size of a beer crate, with a coil of black rubber hose beside it, and it woke the way old machines do: a hiss, a tick, a cough, then a steady breath of steam that rose into air so still the plume hardly bent. Below the hut the glacier lay gray and ribbed under a skin of new snow. Somewhere beneath it, meltwater that had been running since June was still running, faintly, like a tap left on in another room.
Holm is 57, a former carpenter, and has drilled every stake on the glacier since 2006. He does not like having his picture taken and does not much like talking before coffee, but he will explain the drill to anyone, because the drill is the reason there are numbers at all. “You can’t measure what melts,” he said, “unless you put something in it that doesn’t.” That something is a line of 14 stakes driven 10 meters into the lower glacier, each one a ruler standing upright in the ice. Every September a small team walks the line and measures how much of each stake the summer has uncovered. The difference between this year’s reading and last year’s is the year’s loss, written in ice.
Erik Lindqvist is a science writer covering climate, ice, and forests, usually from somewhere without a phone signal. He spent five summers as a field assistant on glacier surveys in the northern ranges and two winters as a forestry inspector before writing The Snowline Moves Uphill, an account of a decade of fieldwork on a single mountainside. He lives in Norhaven, where he skis to the post office from December to March, and he writes his field notes in pencil because ink freezes.
Its telescope is a century old and its funding runs out in March. Its astronomers are using the time they have left to finish a sky survey begun in 1931.
Last September the team was four people: Holm; Aino Rask, a 28-year-old glaciologist with the Norhaven Hydrological Survey; Ingrid Malm, 64, who began the measurements in 2003 and was walking the line for the last time as their leader; and me, carrying the spare propane. By eleven we had read nine stakes. At S3, near the snout, which Holm had drilled in the autumn of 2021, there was nothing to read. The stake lay flat on the ice like a dropped tent pole. All 10 meters had melted out in four summers, and at some point in August it had simply toppled, taking its record of the season’s last weeks with it.
Malm crouched, looked at it for a while and wrote something in the field book. “Well,” she said. “That one we’ll have to estimate.” Then she stood, brushed the snow off her knees, and we roped up again for S4.
Income and expenditure
Glaciologists were talking like accountants long before anyone thought to call it a metaphor. A glacier has a budget. It has a fiscal year, which they call the balance year. It has income: the snow that falls on it each winter, some of which survives the summer and is slowly pressed into firn and then into ice. And it has expenditure: melt, mostly, with a little lost to wind and evaporation. The difference between the two, summed over a year, is the glacier’s mass balance. When deposits outweigh withdrawals, the glacier ends the year in credit, and over time it thickens and advances. When they don’t, it draws on its savings, which in this case means ice laid down over centuries.
The bookkeeping happens twice a year. In late April, while the glacier still wears its whole winter coat, the team pushes a thin steel probe into the snow at about 150 points, feeling for the hard, gritty surface the previous summer left behind, and digs three or four pits to weigh the snowpack, layer by layer, in a tube of known volume. Snow is largely air, so its depth alone says little; what matters is how much water it holds. Depth times density gives the winter balance—the year’s income—in meters of water equivalent.* In September the team returns to read the stakes on the lower glacier, where all the winter snow and some of the ice beneath it have melted, and to dig again on the upper glacier, where some of the snow survives. Income minus spending is the net balance, reported as a single number averaged across the glacier, as though the year had happened to every square meter in the same way.
I had gone up for the spring survey, too, in late April, when the glacier is a different animal: smooth, white and silent, with no hint of the ice beneath. Rask walked a grid with a handheld satellite receiver, stopping every hundred meters or so to push the probe down. It slid through the winter in a series of soft crunches—wind crust, powder, a hard layer left by a February thaw—and then stopped with a small, definite knock. “That’s last summer,” she said, and read off the depth: 2.85 meters. Nearby, Holm cut a clean wall into a pit, and Malm worked down it with a steel tube, weighing each plug of snow on a spring balance hung from a ski pole. The winter of 2025 came in at 1.12 meters of water equivalent, a little below the long-run average. It was, Malm said, a modest salary.
Malm’s mother kept the household accounts for 40 years in narrow green ledgers, one line per purchase, each month ruled off in red. “I didn’t make the connection until much later,” Malm said, “but I set up the field books the same way. Winter on the left, summer on the right, a line under the year.” She talks about the glacier in the vocabulary of a careful household and doesn’t seem to notice: a good winter, a dear summer, a glacier that has been “living off its savings.” The first time I heard her call a year of heavy melt expensive, I assumed she was being wry. She wasn’t. “It is expensive,” she said. “Somebody pays.”
The autumn survey crosses the lower Skarfjell. The line of 14 stakes runs from the snout to what is left of the old firn line. Engraving by Sunniva Holt
Lines in the snow
On the lower glacier, the ledger is written on stakes. On the upper glacier, above the snow line, it writes itself. Each summer, as the surface softens and melts, whatever the winter brought in—windblown dust, pollen, soot from distant chimneys, the occasional stunned insect—is left behind as a thin dark film, and meltwater soaking downward refreezes into a glassy lens of ice. The next winter buries both under fresh snow. Repeat that for a decade and the upper basin becomes a stack of pages, each one bound at the bottom by a gray line marking a summer. Pull a core and you can count the years like tree rings.
In May 2004, Malm and two students hand-augered a 10-meter core near the top of the glacier, at 1,800 meters. It held nine summer lines, so neatly stacked that one of the students, Kalle Brenna, labeled each with a felt-tip pen and photographed the lot laid out on a tarp. “We thought we were looking at the past,” Brenna told me. “We were really looking at the savings.” Those nine years of snow were the glacier’s reserve, compacting under their own weight on the way to becoming ice that would one day flow down to the tongue and melt.
Last spring, Rask augered at the same coordinates. At 1.4 meters the drill struck blue ice. The core held two summer lines, and Rask knew which years had taken the rest: 2018 and 2022, the two summers in which the snow line climbed past the Skarfjell’s 1,860-meter summit and the entire glacier, top to bottom, lost mass. In those years there was nowhere on the ice where income beat spending. Melt reached the old firn and ate into it, and the gray lines that had marked earlier summers ran together and drained away. “People say ice remembers,” Rask said. “It does, until it doesn’t. In a year like 2022 you aren’t only spending this year’s money. You’re burning the old account books.”
You’re burning the old account books.
— Aino Rask
The boundary between the part of a glacier that gains and the part that loses is called the equilibrium line, and its average height is one of the clearest readings there is of the climate a glacier is living in. For a glacier to hold its size, roughly 60 percent of its surface needs to sit above that line. In the Skarfjell’s first five measured years, the equilibrium line averaged about 1,560 meters, and the zone of net income covered a little under half the glacier, which was already not enough. Over the past five years it has averaged 1,790 meters. What remains of the income zone is a strip below the summit that you can cross on foot in 10 minutes.
Twenty-two years of arithmetic
The program began, as many long records do, with a modest question and borrowed equipment. In 2003 the Norhaven Hydrological Survey, a small public agency that gauges rivers for the town and for the Vassdal hydropower reservoir down the valley, wanted to know how much of the river’s late-summer flow came from the glacier. Malm, then a 42-year-old hydrologist with one Arctic field season behind her, proposed measuring the Skarfjell’s mass balance for five years. She borrowed a steam drill from a geology department, recruited two students, and in September 2003 drilled the first 11 stakes.
Holm arrived in 2006, when the geology department asked for its drill back. Rather than buy a new one, the survey hired the Norhaven carpenter who had built its office shelving and who had once, as he put it, “fixed a boiler.” He assembled a drill from a propane camping boiler, a pressure valve salvaged from a dairy and a brass tip machined by a friend at the boatyard. It is the drill he was lighting in September, and apart from its hoses it has not changed in 19 years. “The stakes don’t care what it looks like,” he said. “They care that it’s there in September.”
Malm still has the proposal. “Five years,” she said. “It says five years, in bold.” The survey extended the project once, then again, then stopped extending it and simply put it in the budget, which in a small agency is how a project turns into an institution. The 11 stakes became 14. The field books became 22, one per balance year, waterproof and yellow, filled in pencil and kept in a cardboard box in the survey’s Norhaven office between a broken anemometer and a carton of spare probe tips. The first is in Malm’s handwriting, and its pages from September 2004 read much like those written last September, which is the point of them.
S9 (1,566 m): buried. Dug 0.38 to stake top. Firn line near here?
Pit P2 (1,712 m): 1.86 snow over gray dust line = 2003 surface. Density samples bagged.
S11 bent ~30°. K. says leave it. Re-drill in spring.
K. through to the knee near S7, crevasse margin. Unhurt. Rope from here on.
Last of the cheese. BRING MORE CHEESE.
Ingrid Malm’s entry for the first autumn stake survey, September 2004. “K.” is Kalle Brenna, then a student; stake S11 was re-drilled the following May. Norhaven Hydrological Survey archive
Read a single page of a field book and you have a day on a mountain. Add up 22 years of them and you have something much rarer: a running total. The Skarfjell has had four years in credit since 2003—2005, 2008, 2012 and 2015, each after a snowy winter and a cool, cloudy summer—and 18 in deficit. At the close of the 2025 balance year its cumulative balance stood at minus 17.02 meters of water equivalent. Converted back from water to ice, that is a slab about 19 meters thick, the height of a six-story building, planed off the entire glacier.
Cumulative mass balance of the Skarfjell, 2004–2025
The glacier’s running total at the close of each balance year, in meters of water equivalent averaged over its surface. The four brief upticks are the years it gained mass: 2005, 2008, 2012 and 2015. Source: Norhaven Hydrological Survey, Skarfjell stake network
The shape of the line matters more than where it ends. Across the first 11 balance years the glacier lost an average of 0.56 meters of water a year. Across the next 11 it lost 0.99. There has not been a year in credit since 2015. The two worst, 2018 and 2022, cost 1.86 and 1.74 meters, and in both the snow line ran off the top. Rask points to a mechanism that makes each bad summer worse than the weather alone would. Fresh snow reflects up to 90 percent of the sunlight that falls on it. Old, wet snow reflects perhaps 60 percent; clean glacier ice, 30 or 40; ice freckled with summer dust, less still. The earlier the winter snow melts away, the earlier the dark ice is exposed and the faster it goes. “It’s a debt with interest,” Rask said. “Once you’re spending ice, the rate goes up.”
Most people who notice a glacier shrinking notice its snout, the end of the tongue, creeping back up the valley. The Skarfjell’s has retreated 640 meters since 2003, and its area has fallen from 4.62 square kilometers to 3.71, a fifth of it gone. But the snout is a lagging indicator. A glacier’s length responds to climate over decades, as ice flows down from above to replace what melts; its mass balance responds within a single year. “The length is the house,” Malm said. “The balance is the bank statement. You can go on living in the house for a long time after the money’s gone.”
Who reads the accounts
Kalle Brenna, the student who went through the snow to his knee in 2004, is now 43 and runs the intake at the Vassdal reservoir, 31 kilometers down the valley. He reads the Skarfjell’s ledger from the other side: every liter the glacier loses in summer passes his gauges on its way to the turbines. In the hot, dry August of 2022, by the survey’s estimate, meltwater from the glacier made up 41 percent of the water entering the reservoir. In the Augusts of the program’s first five years, it averaged 17 percent.† “In a hot summer the glacier subsidizes us,” Brenna said. “The rain stops, the snow on the hills is long gone, and the ice keeps paying out. It’s been a very generous relative.”
Hydrologists have a name for what comes next: peak water. As a glacier warms, it melts faster and its runoff rises—for a while. But a shrinking glacier has less ice to melt, and eventually the shrinking area outweighs the faster melting. Runoff peaks and then falls, for good, and it falls hardest in the late-summer weeks when a river has nothing else to draw on. The survey’s modeling suggests the Skarfjell is at or near its peak now. “All those Augusts when the glacier paid out more, we called them good water years,” Brenna said. “It wasn’t income. It was capital. We were living off an inheritance and calling it a salary.”
We were living off an inheritance and calling it a salary.
— Kalle Brenna
The ledger matters to people who will never see the glacier. The reservoir’s operators use it to plan their autumn drawdown; the town’s water engineers use it to estimate the river’s summer lows; and every winter the survey sends its numbers to the international archive that gathers mass-balance records from glaciers around the world, where the Skarfjell is one line among a few hundred. The whole program costs the survey about what it pays one junior technician. Malm has defended that line through 22 budget rounds. “Nobody ever argues with the number,” she said. “They argue about whether we need to keep writing it down.”
Handing over the book
Aino Rask first came to the Skarfjell in the spring of 2017, as a 20-year-old undergraduate, to dig snow pits. She grew up in Norhaven, in a house from which, on clear days, the glacier showed as a white thumbprint on the ridge. “It was just there,” she said. “Like the church. I never thought of it as something that could stop.” She has worked every spring and autumn survey since, and on January 1 she became the program’s leader. Malm stays on as an adviser and, she says, a porter. “I can still carry propane. I just don’t have to decide where it goes.”
Reading a stake: the length exposed since last autumn, less any snow still lying around it, is the year’s melt at that spot. Engraving by Bram Keller
Handing over a long record is delicate work. Every measurement series carries habits that live nowhere except in the heads of the people who make it: how hard to push a probe before deciding it has reached last summer’s surface and not a buried lens of ice, which way to face when reading a stake on a slope. A change of hands can put a step in the data as abrupt as any change in the weather. So for the past three seasons Malm and Rask have read every stake independently and compared numbers afterward. Their readings now agree to within a centimeter on 13 of the 14 stakes. On the remaining one, S10, which stands on a slope, they disagreed by three centimeters two years running, until Holm noticed that Rask was reading from the uphill side. “So now it’s in the protocol,” Rask said. “Read from downhill. Twenty-two years, and nobody wrote it down, because it was never anybody’s first year.”
Rask is clear-eyed about what she has inherited. The survey’s projection, which she finished in November, suggests that with the warming already under way the Skarfjell will lose its last zone of net income for good sometime in the 2030s.‡ After that it becomes what glaciologists call dead ice: a body that no longer renews itself and barely flows, and simply waits to melt, which may take several more decades. She expects, in other words, to be the person who closes the account. “People ask if that’s depressing,” she said. “It would be more depressing not to know. If you stop measuring, you don’t stop losing it. You just lose the record as well.”
That night in the hut, with the stove ticking and the windows black, they did the arithmetic. Rask read out the stake values. Malm entered them in the field book. Holm, who distrusts spreadsheets, ran the same sums on a pocket calculator with a cracked screen, and the two answers matched. With S3 estimated from its neighbors, the provisional net balance for 2025 came to minus 1.47 meters, the third-worst year on the record; when the upper basin was mapped in October, the number held. Malm ruled a line under it, the way her mother had ruled off the household months, and wrote the running total beside it: minus 17.02.
Then she closed the book and slid it across the table to Rask. Nobody made anything of it. Rask put it in the plastic bag with the pencils, and in the morning we carried it down along with the stake from S3, all five segments strapped to Holm’s pack. The stake now leans in a corner of the survey’s office, next to the cardboard box, with its dates written on it in marker: 2021–2025. Next September, Rask will drill its replacement 40 meters farther up the glacier, where the ice is still thick enough to hold it. She has already marked the spot on the map.
Notes
*The Skarfjell program follows the standard glaciological method. Winter balance comes from about 150 probe soundings and three or four density pits; summer balance from the 14 ablation stakes and, above the snow line, from pits and shallow cores. Point values are averaged within 50-meter elevation bands and weighted by each band’s area on the most recent map. Every five years the summed stake record is checked against a geodetic survey, an aerial measurement of the change in surface height; in 2024 the two methods agreed to within 0.8 meters of water equivalent over the preceding 20 years. The survey puts the uncertainty on any single year at about 0.25 meters. ↩
†Glacier share of reservoir inflow as estimated by the Norhaven Hydrological Survey from the Skarfjell summer balance, the glacier’s mapped area and daily records from the Vassdal intake gauge: 17 percent (mean of the Augusts of 2004–2008) and 41 percent (August 2022). Interview with Kalle Brenna, Vassdal, October 2025. ↩
‡Aino Rask, Skarfjell 2026–2080: A Simple Mass-Balance Projection, internal report, Norhaven Hydrological Survey, November 2025. The report drives a temperature-index melt model with three regional warming scenarios. In all three, the average equilibrium line sits above the summit by the late 2030s, and the glacier’s area falls below one square kilometer at some point between 2058 and 2071. ↩